Original public data study
London moving access pressure index for all 33 authorities
This comparative index combines three official housing and population signals to show where a move may deserve earlier access planning. It does not predict the difficulty or price of an individual job.
At a glance
What this guide helps you organise
- The score compares London authorities with one another. It does not estimate the difficulty, duration or cost of a particular move.
- Each authority receives equal weight for household flat share, converted or commercial accommodation within flats and 2024 population density.
- Islington ranks first in this edition, followed by Camden, Kensington and Chelsea, Hammersmith and Fulham, and Lambeth.
- The complete source checked data file is available as CSV and includes all component values and percentile scores.
Meaning before ranking
What the index measures and what it cannot tell you
A borough level score can help decide where earlier access questions are useful, but it cannot inspect a doorway, reserve a lift or identify a lawful loading position.
The London moving access pressure index is an original Men With Van comparison built from official aggregate data. It asks a narrow planning question: which London authorities combine a high share of households in flats, a high share of flats in converted or commercial buildings, and high population density? Those conditions can make it sensible to ask about stairs, lifts, turns, shared entrances, carrying distance and street access earlier in the quote process.
The score is not a measure of service quality, household wealth, neighbourhood desirability or removal demand. It does not claim that every move in a high ranking authority is difficult or that a lower ranking authority is easy. A ground floor purpose built flat with a booked loading bay may be simpler than a detached house reached by a long narrow path. The actual route still controls the plan.
Each observation is an authority level aggregate. No customer address, booking, review, quote, phone number or personal record was used. The score is therefore suitable for public comparison, but not for deciding the crew, vehicle or price for one customer.
Source selection
Why the method uses three public planning signals
The selected inputs are available for every London authority, have clear public definitions and relate to a real access question without pretending to describe each building.
Household flat share is calculated from the Office for National Statistics Census 2021 accommodation type table. It combines households in purpose built blocks, converted or shared houses, other converted buildings and commercial buildings. A higher share does not prove the presence of stairs or a lift, but it shows that building access questions apply to a larger part of the local housing stock.
Converted or commercial share within flats uses three Census categories: part of a converted or shared house, part of another converted building, and accommodation in a commercial building. These properties can have routes that were not designed as a standard purpose built residential block. That can make current measurements and photographs more useful, although the category alone does not reveal the width or condition of any route.
Population density uses the ONS value for 30 June 2024, expressed as people per square kilometre. Density is a broad street and building pressure signal. It cannot show parking rules, road width or traffic at a specific time, so those checks remain separate. The downloadable file also includes the share of households in the ONS RM001 combined flat, maisonette, apartment, caravan or other mobile or temporary category with no car or van as context. That measure is not used in the index score because vehicle ownership is not direct evidence of access.
Transparent calculation
How the score is calculated and ranked
Every component is converted to a London percentile before the three values are averaged, so different units can be compared without allowing one raw scale to dominate.
For each component, the lowest observed authority receives a percentile score of 0 and the highest receives 100. Values between them are ranked across the 33 authorities. Tied raw values receive the average of their rank positions. The final index score is the simple mean of the flat share percentile, the converted or commercial flat mix percentile and the population density percentile.
Index score = one third flat share percentile + one third converted flat mix percentile + one third population density percentile. Equal weight was chosen to make the editorial judgement visible and easy to reproduce. The weights are not a scientific estimate of how many minutes a factor adds to a move.
The main ranking is reasonably stable at the top, but not fixed by nature. When flat share is removed, seven of the original upper-quartile authorities remain; Brent enters and Lewisham leaves. When density is removed, seven remain; Brent enters and Hackney leaves. When converted or commercial flat mix is removed, six remain; Tower Hamlets and Westminster enter while Haringey and Lewisham leave. This sensitivity is why the component values are published beside the combined score.
When two authorities have exactly the same unrounded combined score, the table uses borough name in ascending alphabetical order solely to keep the output deterministic. That display order does not represent a measured difference. The exact tied pairs are Camden and Kensington and Chelsea; Hackney and Haringey; Brent and Wandsworth; City of London and Merton; Barnet and Richmond upon Thames; and Bexley and Hillingdon.
The score is rounded to one decimal place for display. Rank numbers are table positions produced from the unrounded score and the disclosed tie-order rule. An exact tied pair has no measured ordinal separation.
Results in context
What the upper quartile shows in this edition
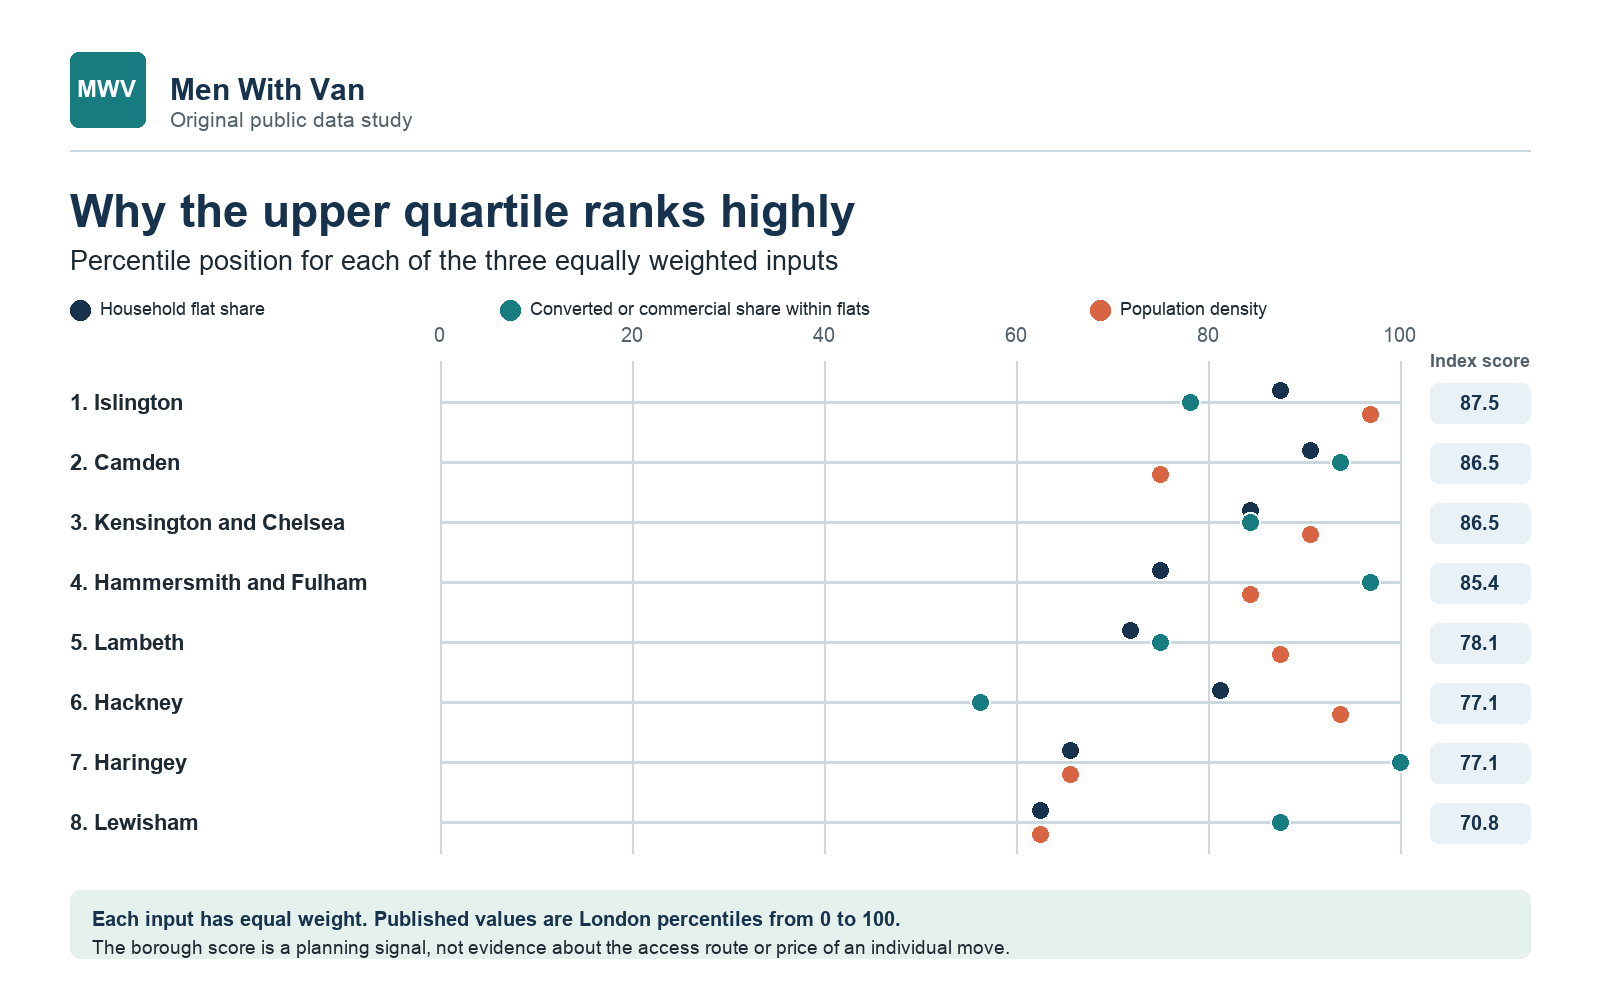
The first eight places are Islington, Camden, Kensington and Chelsea, Hammersmith and Fulham, Lambeth, Hackney, Haringey and Lewisham.
Islington ranks first with a score of 87.5. Census 2021 records 83.6 percent of its households in flats, while 31.4 percent of those flat households are in converted or commercial categories. Its 2024 population density is 15,010 people per square kilometre. The result comes from a high position on all three inputs rather than one extreme value.
Camden and Kensington and Chelsea are exactly tied at 86.4583 before display rounding and both display as 86.5; they are ordered alphabetically in the table for deterministic presentation only. Hammersmith and Fulham follows at 85.4, then Lambeth at 78.1. These are comparative scores. They indicate that a mover, estate agent, resident or building manager may benefit from confirming the complete route and building rules early, not that every property needs the same service.
Tower Hamlets illustrates why the components matter. It has the highest 2024 density in the table and 87.8 percent of households are in flats, but only 8.1 percent of those flats fall in the converted or commercial categories used here. It ranks twelfth rather than first. The City of London has the highest flat share at 98.0 percent, yet ranks seventeenth because its other two relative positions are lower.
No rank should replace the property evidence. Use the moving access worksheet for the actual item and route, and confirm a service lift where building management controls one.

Complete comparison
All 33 London authority results
The table shows the combined score and the three raw values behind it. Percentages are based on Census 2021 households and density is the ONS value for 30 June 2024.
| Rank | Authority | Index score | Households in flats | Converted or commercial share of flats | People per square kilometre |
|---|---|---|---|---|---|
| 1 | Islington | 87.5 | 83.6% | 31.4% | 15,010 |
| 2 | Camden | 86.5 | 86.6% | 35.0% | 9,961 |
| 3 | Kensington and Chelsea | 86.5 | 82.9% | 31.6% | 11,918 |
| 4 | Hammersmith and Fulham | 85.4 | 75.3% | 36.1% | 11,504 |
| 5 | Lambeth | 78.1 | 75.1% | 31.4% | 11,822 |
| 6 | Hackney | 77.1 | 80.9% | 25.4% | 14,007 |
| 7 | Haringey | 77.1 | 61.0% | 42.0% | 8,912 |
| 8 | Lewisham | 70.8 | 57.7% | 32.3% | 8,572 |
| 9 | Brent | 69.8 | 56.7% | 32.9% | 8,164 |
| 10 | Wandsworth | 69.8 | 68.5% | 29.8% | 9,855 |
| 11 | Westminster | 67.7 | 89.7% | 21.8% | 9,775 |
| 12 | Tower Hamlets | 64.6 | 87.8% | 8.1% | 16,787 |
| 13 | Southwark | 62.5 | 78.0% | 17.4% | 10,901 |
| 14 | Waltham Forest | 59.4 | 44.8% | 31.5% | 7,208 |
| 15 | Ealing | 58.3 | 49.5% | 30.3% | 6,949 |
| 16 | Newham | 53.1 | 52.7% | 17.3% | 10,347 |
| 17 | City of London | 45.8 | 98.0% | 11.2% | 5,229 |
| 18 | Merton | 45.8 | 39.6% | 28.3% | 5,808 |
| 19 | Greenwich | 40.6 | 51.5% | 16.4% | 6,331 |
| 20 | Croydon | 39.6 | 39.7% | 27.0% | 4,734 |
| 21 | Barnet | 37.5 | 47.4% | 22.9% | 4,668 |
| 22 | Richmond upon Thames | 37.5 | 39.9% | 29.5% | 3,427 |
| 23 | Hounslow | 36.5 | 45.8% | 18.2% | 5,350 |
| 24 | Redbridge | 35.4 | 33.6% | 24.6% | 5,696 |
| 25 | Harrow | 34.4 | 34.6% | 24.1% | 5,365 |
| 26 | Kingston upon Thames | 28.1 | 38.3% | 22.3% | 4,635 |
| 27 | Enfield | 25.0 | 38.7% | 21.5% | 4,052 |
| 28 | Sutton | 22.9 | 37.1% | 15.7% | 4,893 |
| 29 | Bromley | 21.9 | 31.3% | 24.9% | 2,234 |
| 30 | Barking and Dagenham | 20.8 | 31.1% | 11.0% | 6,447 |
| 31 | Bexley | 9.4 | 24.7% | 13.6% | 4,234 |
| 32 | Hillingdon | 9.4 | 30.8% | 15.1% | 2,845 |
| 33 | Havering | 5.2 | 23.1% | 13.9% | 2,459 |
Tie note: exact unrounded score ties are displayed alphabetically by borough only to keep the table deterministic. The order within a tied pair is not a measured difference.
The converted or commercial column is a share of flat households, not a share of all households. Population density is shown as people per square kilometre. The published CSV adds the authority code, household counts, no car or van context, component percentiles, rank and relative quartile.
Address level planning
How to use the index for a real London move
Use the score as a prompt for better questions, then replace the borough level signal with current evidence from the pickup and delivery routes.
Start with the item list, collection address, delivery address, floor level, lift availability and the lawful position where the removal vehicle can stop. Record the carrying distance from that position to the entrance. A borough score cannot tell whether a bay suspension, loading restriction or red route rule applies, so check the signs and the responsible authority for the exact street. The London moving day parking guide explains that separate process.
Inside the building, confirm the route in travel order. Note gates, shared doors, corridors, stairs, turns, landing space, lift door and cabin dimensions, booking times, protection rules and the final room. Do not infer a lift from the words purpose built flat, or infer narrow stairs from the words converted building. Current photographs and measurements are stronger evidence than a category. When a property has a confirmed upper floor route without a usable lift, use the upper floor stair move guide to record flights, landings, item dimensions and shared route controls. It does not infer access from the borough score or approve a stair plan.
Send the access record before crew, van and time assumptions are fixed. The Men With Van quote guide shows how a quote is shaped by journey details, crew size, vehicle needs, carrying routes, stopping arrangements and the time required. The index does not add a borough charge or change the public calculator.
- Confirm the lawful vehicle position and carrying distance.
- Measure the complete item route at both addresses.
- Book any service lift through the building.
- Record every unknown so the mover can review it.
- Recheck the route if the building or street arrangement changes.
Limits and revision
Important limitations and the update policy
The index is designed to be inspectable, so its omissions and editorial choices are part of the publication rather than hidden behind a single rank.
The housing inputs describe households on Census Day, 21 March 2021. The population density input describes 30 June 2024 and was published by ONS in September 2025. They are the latest suitable complete authority level sources found when this edition was checked on 28 July 2026. Housing stock and population can change after those dates.
ONS applies statistical disclosure control independently to Census tables. As a cross-check, this study compared TS044 flat counts with RM001's broader combined category, which also includes caravans and other mobile or temporary structures. Across the 33 authorities, the largest relative difference was 1.17 percent. TS044 remains the controlling source for the scored flat measures; RM001 supplies only the explicitly labelled unscored context.
The model does not include road width, parking suspension cost, red route length, lift provision, building height, tenure, traffic at a chosen time, removal demand, complaint data or Men With Van bookings. Consistent public observations for all 33 authorities were not added merely to make the model look larger. A later edition will change only when a source or method can be documented and reproduced.
A material data correction, source revision or method change will receive a new revision date and a note explaining the difference. Historical editions should not be compared without checking whether the source geography and definitions remain the same.
Data and attribution
Download, inspect and reuse the source checked data
The complete CSV is published so an editor, researcher, housing team or resident can inspect every component instead of relying on the headline ranking.
Download the London index CSVDownload the top ten chartDownload the component chart
Source: Office for National Statistics licensed under the Open Government Licence v.3.0. Men With Van created the calculated percentile scores, combined index, explanation and ranking. When reusing those calculations, attribute Men With Van and link to this page so readers can see the method, source dates and limitations.
For a correction, data question or request for a plain table, contact info@menwithvan.com and include the authority, field and source being queried. Editorial enquiries can also use the Men With Van media resources page.
Sources and checks
Official datasets and definitions used for this study
Published datasets and revisions can change. Check the named edition, source date and update note before reusing a value.
- ONS Census 2021 accommodation type datasetChecked 14 August 2026
- ONS Census 2021 accommodation and car or van availability datasetChecked 14 August 2026
- ONS population density indicator and downloadsChecked 30 July 2026
- ONS Census 2021 accommodation type definitionChecked 30 July 2026
Common questions
Questions about the London moving access pressure index
Which London authority ranks first in the 2026 edition?
Islington ranks first with an index score of 87.5 because it places highly for household flat share, converted or commercial accommodation within flats, and 2024 population density.
Does a higher score mean my move will cost more?
No. The score does not predict price, time, crew or vehicle requirements. A real quote needs the item list, route, floor, lift, parking, carrying distance and service details.
Why are Census 2021 housing figures used in a 2026 edition?
Census 2021 provides one consistently defined accommodation table for every London authority. The edition date records when the calculation and source checks were published, not the date of every underlying observation.
Is the index an Office for National Statistics product?
No. ONS supplies the aggregate housing and population density observations. Men With Van selected the three components, calculated their London percentiles and created the combined index and ranking.
Can I download the full London authority data?
Yes. The linked CSV contains all 33 authorities, raw component values, context fields, percentile scores, combined scores, ranks and relative quartile labels.
Plan the actual route
Turn the borough signal into address level evidence.
Share both addresses, floor levels, lift details, lawful loading position, carrying distance, item list and current access photographs so the quote reflects the real move rather than an authority average.